Gráficos no padrão insyde.one
Branded matplotlib charts — styled by default, vector-ready
O matplotlib no sandbox já vem pré-estilizado com a marca insyde.one (navy
#0f0051, verde #00ff80, azul #3cc5f5, cinza
#79858d, fonte DM Sans, decimais com vírgula pt-BR). É o default —
você só plota; não chame plt.style.use(...) nem
sns.set_theme().
matplotlib ships pre-styled with the insyde.one brand. It is the default — just plot; don't set
a style or seaborn theme. The named style is also available as plt.style.use("insyde").
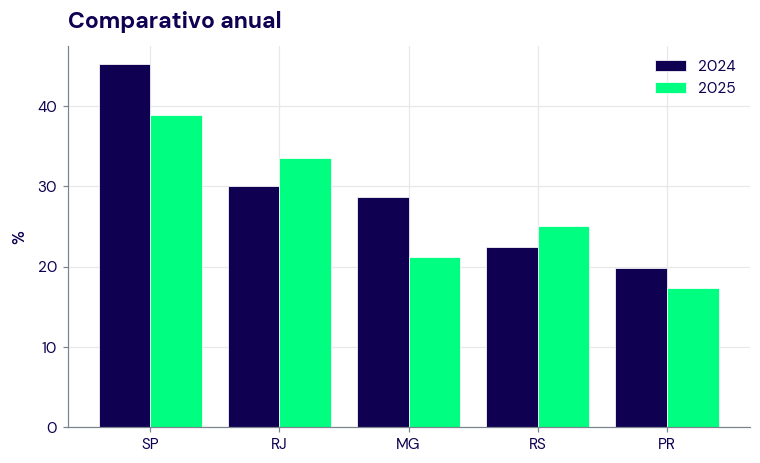
1. Um gráfico, zero configuração
import matplotlib.pyplot as plt
fig, ax = plt.subplots()
ax.bar(["SP", "RJ", "MG"], [1234.5, 987.6, 1500.0])
ax.set_title("Receita por estado")
ax.set_ylabel("R$ milhões")
# a figura aberta é capturada automaticamente como artifact PNG — não chame savefig()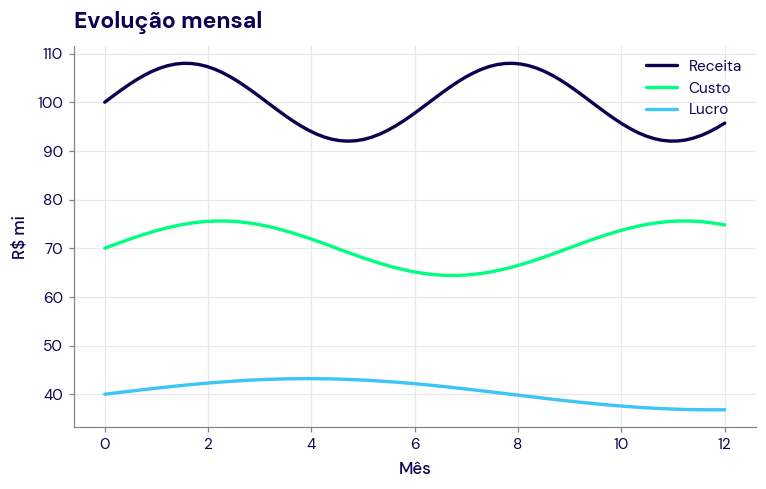
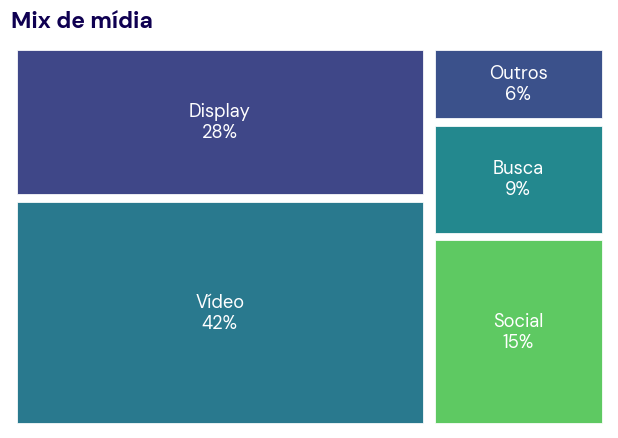
squarify treemap.navy → verde → azul → cinza →
#7a5cff → #00b35f, então séries múltiplas já saem distinguíveis e on-brand. Série única =
navy. / The categorical cycle is brand-on by default; single series renders navy.
2. Saída vetorial (SVG) para broadcast
Para gráficos que vão pra TV ou edição (After Effects/Illustrator), salve SVG:
vetor nítido e editável. A captura automática só gera PNG — emita .svg
explicitamente. / For broadcast/editable output, save SVG explicitly.
fig.savefig("outputs/grafico.svg") # vira artifact com URL pública3. Hemiciclo / parlamento
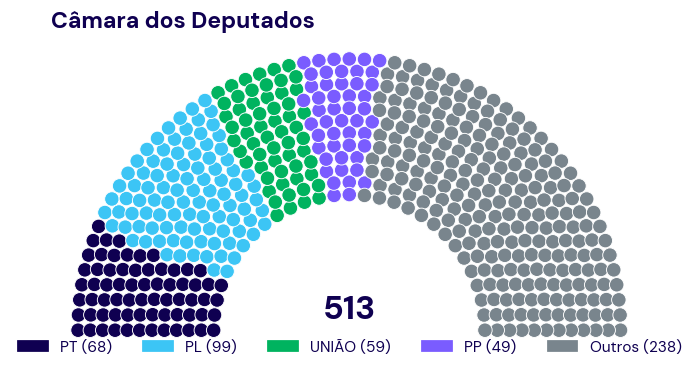
Duas vias: parliamentarch (gera o SVG das cadeiras → cairosvg.svg2png),
ou ~25 linhas de matplotlib (arcos concêntricos de pontos, já no padrão da marca):
from parliamentarch import SeatData, get_svg_from_attribution
import cairosvg
attrib = {SeatData("PT", "#0f0051"): 68,
          SeatData("PL", "#3cc5f5"): 99}
svg = get_svg_from_attribution(attrib)
cairosvg.svg2png(bytestring=svg.encode(),
                 write_to="outputs/hemiciclo.png")
API reference · Mapas · Altair · Live demo · Back to Insyde APIs